Research
Visibility Contrast Imaging
In X-ray Talbot (or Talbot-Lau) interferometry, we can obtain three kinds of images: absorption, differential-phase, and visibility-contrast (ultra-small-angle-scattering contrast) images. In Fig. 1, three kinds of images of chloroprene rubber (CR) sponge are demonstrated.
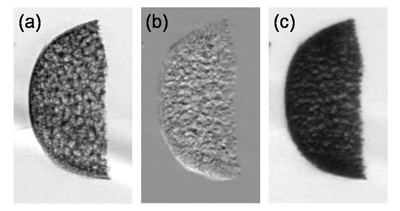
Fig. 1 Images of chloroprene rubber (CR) sponge obtained by X-ray Talbot-Lau interferometry [1]. (a) absorption, (b) differential phase, and (c) visibility-contrast images.
Here we explain how to obtain the three kinds of images in the case of a fringe scanning method. In an M-step fringe scanning method based on the equal sampling algorithm (M is an integer and more than 2), one of two gratings (G1 or G2 in Fig. 4) in X-ray Talbot interferometer is moved in steps of 1/M of the grating period in the direction perpendicular to the grating lines, and then M moire´ images are obtained (an example is shown in Fig. 2 for M = 5).
Fig. 2 Change of moire´ image in a fringe scan for M = 5.
As shown in Fig. 3, the behavior of the intensity obtained at a pixel of detector (for example, square at point A in Fig. 2) can be usually approximated by a sine function plus a constant. In general, this function has three independent free parameters: amplitude (a), phase (
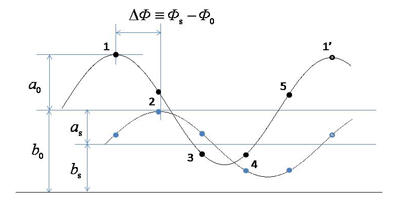
Fig. 3 Behavior of the intensity at a pixel (for example, point A in Fig. 2) in a fringe scan (M = 5). Blue and black filled circles are the intensities with and without a sample. Subscripts ‘s’ and ‘0’ for the three parameters, a,
We showed that the origin of the visibility contrast is unresolvable spatial fluctuations of wavefront formed by microstructures with a size comparable to the grating period (typically a few μm) in a sample as shown in Fig. 4 [2]. Generally, it is known that ultra-small-angle X-ray scattering (USAXS) occurs from such microstructures. For this reason, the visibility-contrast image is often called USAXS contrast image. This means that we can obtain an image of 2D distribution of USAXS in real space by using the X-ray Talbot interferometer. Analysis of anisotropy of microstructures in a sample [1] and tomography were also successfully performed [3].
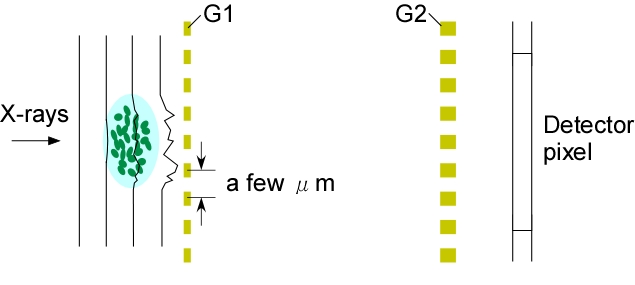
Fig. 4 Illustration of unresolvable spatial fluctuations of wavefront due to microstructures in a sample which have a size comparable to the grating period (typically a few μm). This fluctuations causes the visibility contrast in the X-ray Talbot interferometry [2].
[1] W. Yashiro, S. Harasse, K. Kawabata, H. Kuwabara, T. Yamazaki, and A. Momose, "Distribution of unresolvable anisotropic microstructures revealed in visibility-contrast images using x-ray Talbot interferometer", Phys. Rev. B 84 (2011) 094196.
[2] W. Yashiro, Y. Terui, K. Kawabata, and A. Momose, “On the origin of visibility contrast in x-ray Talbot interferometry”, Opt. Exp. 18 (2010) 16890-16901.
[3] W. Yashiro, S. Harasse, H. Kuwabara, K. Kawabata, and A. Momose, “Quantitative visibility-contrast tomography in the X-ray Talbot interferometry”, AIP Conf. Proc. 1466 (2012) 211-216.